QUARTILE.INC Function
A function in Excel that calculates the specified quartile (e.g., Q1, Q3) of a dataset, excluding extreme outliers

What is the QUARTILE.INC Function?
The QUARTILE.INC function in Excel calculates the specified quartile (e.g., Q1, Q3) of a dataset, excluding extreme outliers.
Quartile is a statistical term that divides data into three equal parts; each part is referred to as a quartile. The quartile calculation is widely used in various applications such as descriptive statistics, data analysis, and financial analysis.
Quartiles divide numerical data into four equal parts. The three quarters are called Lower, Median, and Upper Quartile.
- The Lower Quartile or Q1 denotes that 25% of data falls below it
- The Median Quartile, or Q2, is the Middle value or 50% of the data set
- The Upper Quartile or Q3 denotes that 75% of data falls below it
- The rest of the data is above Q3; thus, quartiles divide the data into three intervals, each containing one-fourth of the data
You can see these groups graphically to understand the function of Quartiles better.

Here, we see the graph divided into four equal parts. The first part is the median, which equally divides the graph into two halves. The First Quartile, or Q1, is the median of the lower half of the data. The Third Quartile, or Q3, is the median of the upper half of the data.
Key Takeaways
- The QUARTILE.INC function in Excel calculates specific quartiles (e.g., Q1, Q2, Q3) of a dataset, aiding in statistical analysis and understanding data distribution.
- The syntax is =QUARTILE.INC(array, quart), where 'array' is the dataset, and 'quart' represents the quartile value (0 to 1), indicating the specific quartile to calculate.
- To calculate specific quartiles, input the dataset and quartile value into the function. Quartile values help interpret data distribution and identify key data points, aiding decision-making and analysis.
Understanding The QUARTILE.INC Function
The QUARTILE.INC function is a statistical function that calculates specific quartiles for a dataset.

The Quartile.INC function in Microsoft Excel calculates the quartiles of a set of data based on a given percentile in the quart argument, such as Q1, Q2, and Q3, inclusive of the values at the quartile thresholds.
QUARTILE.INC Function Formula
The syntax of the function is
=QUARTILE.INC(array, quart)
where:
- Array: is the range of cells containing the data set for which you want to calculate the quartile
- Quart: is the quartile value you want to calculate, represented as a decimal value between 0 and 1, where 0 corresponds to the minimum value, and 1 corresponds to the maximum value. The values 0, 0.25, 0.5, 0.75, and 1 correspond to the minimum, first quartile (25th percentile), median, third quartile (75th percentile), and maximum values, respectively
| Value | Quart |
|---|---|
| 0 | Minimum Value |
| 1 | Q1 - Values below the 25th percentile lie below this number |
| 2 | Q2 - Values below the 50th percentile lie below this number |
| 3 | Q3 - Values below the 75th percentile lie below this number |
| 4 | Maximum Value |

How to Interpret the Quartile Values?
We are going to use a basic example to demonstrate the function. In our example, we have a set of numbers from 1 to 100, and we will use the function to find the five different quartile values of this range.

Here, the numbers are in random order, making it difficult to calculate the percentile values. We also need to know the minimum and maximum values.
Then, we can use the QUARTILE.INC function calculates quartile values based on the dataset provided, including the Minimum and Maximum values along with the three quarters.
In our example, we can easily find the end values by looking at the data, i.e., 13 and 96, but this function will make it easier, especially when the data is extensive.

We type in the function name, select the range of our array, and press a comma(,) to select quart or quartile. We can see the number along with the value it represents. To select the Minimum value, you can enter 0 as the quartile parameter in the QUARTILE.INC function.
We will type in the formula in the cells below and change the quartile value according to the quartile we need. We must analyze the data to see all the quartiles and extremes, i.e., minimum and maximum values.

The formula shows that 13 and 96 are the minimum and maximum values in the data set. Q1, or the first quartile, is 32. This means that 25% of the data is below 32. Q2, or the second quartile, is 57, representing 50% of the data below. Q3, or the third quartile, is 75, meaning 75% of the data is below it.
Now, what can we interpret from this? Looking at the 1st quartile, we see that the answer displayed is 32.
Accordingly, the 1st quartile (Q1) value of 32 means that 25% of the data falls below this value. Since the minimum value in our dataset is 13, all values from 13 to 32 are included in the 1st quartile.
Similarly, in the 2nd and 3rd quartiles, we see 57 and 75 as the answers. This means that the dataset's median is 57, and three-quarters of the data is below 75.
How to use the QUARTILE.INC Function in Excel?
The Quartile INC function is simple, requiring only two arguments. Here are some examples of how to use it.
Let's take an everyday and relatable example of grading marks. We have a data set with the names of students and marks scored in respective subjects.

First, to get the quartiles, we need to add the marks of each subject. Here, we have used the =SUM function for this task. We will use the total marks as our range for the Quartile INC function.
To get the minimum quartile (Q0), we type the formula, select the range, and use 0 as the quart argument in the QUARTILE.INC function. You can see that we have added a dollar sign to the formula. This is because we want the range locked when we drag the formula down.

=QUARTILE.INC($F$2:$F$10,0)
We must manually adjust the quart argument in the QUARTILE.INC function to display the desired quartile according to the corresponding title in column H.

We can see all three quartiles correctly, including the maximum and minimum values. But how do we ensure that the quartiles displayed are correct?

One way to make the dataset easier to compare with the quartiles is to sort the data in ascending order. We can do this by selecting the dataset and then selecting Sort and Filter in the Home Tab under the Editing section. Here, we will choose Sort from Smallest to Largest.

Alternatively, we can use the keyboard shortcut ALT + H + S + S, which will Sort the data in ascending order.

Now that our data is sorted, we can manually check the correct values. At one glance, we see that the minimum and maximum values are correct.
We will represent the data as a percentage to understand the quartiles better. If the total score is 100%, then each score would be a percent of the total. There are nine scores in our dataset. If we divide 100 percent by the total scores, each will represent 11.11% of the total. (100/9 = 11.11).
The First quartile, or Q1, is 292. This means that the total score of 292 is the 25th percentile of the total. Since the total observations are 9 (an odd number), there is no data interpolation.

The Second quartile or Q2 is 303. This means that the total score of 303 is the 50th percentile of the total. This quartile is also the median of the dataset.
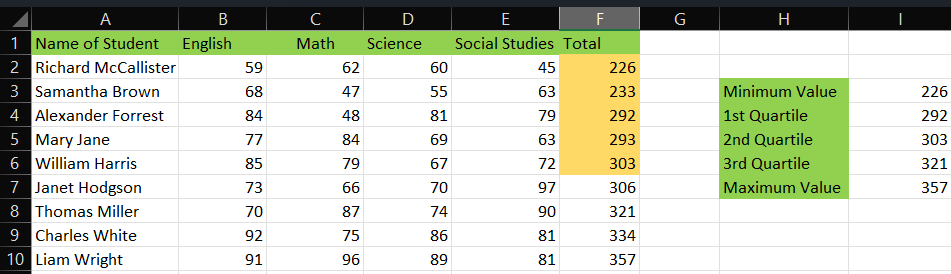
The Third quartile, or Q3, is 321. This means that the total score of 321 is the 75th percentile of the total. This leaves two scores, 334 and 357. We know that 357 is the maximum value, but what about 334? It means it lies between the maximum value and the 75th percentile or Q3.


QUARTILE Vs. QUARTILE.EXC
We have seen how the Quartile.INC function works, but you may have seen two more formulas when typing in the Quartile.INC function. They are Quartile.EXC and Quartile functions.
Now, you may be curious how these are different from our function. Well, we have got you covered. Below, we will see the differences between these functions.
The Quartile function is the first function in Excel that calculates data quartiles. It works in the same way as the Quartile.INC function both calculates the maximum and minimum values.
The Quartile.EXC function was introduced in Excel 2010 and excludes the extreme data ends. So why the new ones, you ask? Microsoft wanted to give us two formulas to calculate quartiles using two different methods.
| Quartile | Quartile.EXC |
|---|---|
| It is the first function in Excel to calculate quartiles. | This function was introduced in Excel 2010. |
| It includes the maximum and minimum values. This is what the INC Suffix means. | It excludes the maximum and minimum values. |
| It includes the median value when calculating each quartile. | It excludes the median value when calculating each quartile. |
| This function has no suffix, as there was only one function. The Quartile.INC function is similar and has an INC suffix as it includes the above conditions. | The function has an EXC suffix, as it excludes the conditions above. |
| Is compatible with old and new versions of Excel. | Is not backward compatible with Excel versions older than 2010. |
Formula
The syntax for both functions is
=QUARTILE(array, quart)
&
=QUARTILE.EXC(array, quart)
where:
- Array: is the range of cells containing the data set for which you want to calculate the quartile
- Quart: is the quartile value you want to calculate
The values in the quart argument are the only difference in both functions. In the Quartile.EXC, the quart argument has only three quartiles, with numbers 1, 2, and 3 representing each quartile.

In the Quartile function, we have two more quartile options. Numbers 0 and 4 are the additional numbers here that represent Maximum and Minimum values.

Examples
Let us see an example demonstrating the difference between the two functions. In our example, we have a simple dataset and will use both Quartile and Quartile.EXC function on the same range.

We will type in the formula and the quart type in the value according to the heading in both functions. We see that the Quartile.EXC function displays a #NUM! Error for both end values.

First, we will sort the data set into ascending order to better understand the function. We see that the minimum and maximum values are correct. However, the quartiles for both functions differ.

This is because the first function divides the data into two halves and includes the median when calculating the quartiles, while the second function excludes the median.
Free Resources
To continue learning and advancing your career, check out these additional helpful WSO resources:

or Want to Sign up with your social account?